

What the Data Shows About Breast Augmentation (2000–2022)

Abstract
This reference brief synthesizes the most recent credible statistics from the American Society of Plastic Surgeons (ASPS, U.S.) and the International Society of Aesthetic Plastic Surgery (ISAPS, global). It covers long-run procedure trends (U.S. vs. world), patient age distribution, implant-type preferences, and cost structure, followed by recovery/safety context and methods. Sources are cited inline.
Key points
- Global aesthetic surgery has grown steadily; breast augmentation remains among the most common cosmetic procedures for women. Pandemic-era deferrals produced a visible 2020 dip with a rebound in 2021–2022.
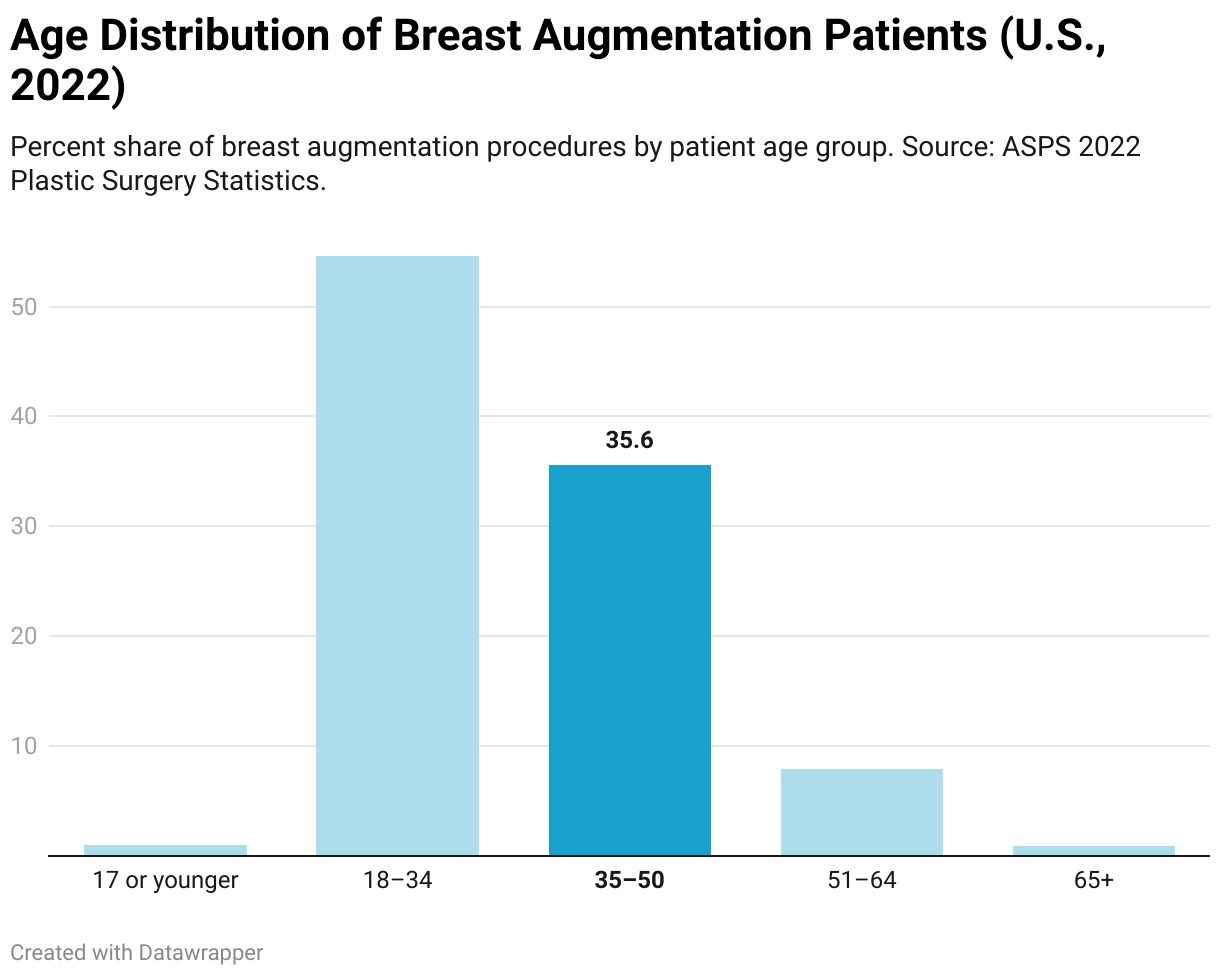
- U.S. age mix (ASPS 2022): concentration in ages 18–34, followed by 35–50. American Society of Plastic Surgeons
- Implant types: modern procedures overwhelmingly use silicone vs saline (global ≈ 96% silicone, ~4% saline in 2023). isaps.org
- Costs: ASPS 2022 average surgeon’s fee for augmentation: $4,294; total patient cost is higher once anesthesia/facility/implants are included. American Society of Plastic Surgeons
- Safety context: FDA: silicone gel implants have a reasonable assurance of safety and effectiveness when used as labeled; decisions should be individualized. U.S. Food and Drug Administration
Contents
1) Long-run trends (U.S. vs. world)
Elective procedures dropped sharply in 2020 due to temporary deferrals, then recovered as access returned. ISAPS 2022 and 2023 reports confirm sustained global procedure growth; breast augmentation remains a leading surgery for women.
Breast Augmentation: U.S. vs. Global (2000–2022)
Caption: Annual augmentation procedures in the United States vs. worldwide (selected years, 2000–2022). Sources: ASPS (U.S.) and ISAPS (global).
2) Who gets augmentation? (Age distribution)
ASPS shows a consistent concentration among 18–34 with a substantial secondary share 35–50; procedures below 18 are rare and require special clinical considerations. American Society of Plastic Surgeons
Age Distribution (U.S., 2022)
Create in Datawrapper (100% stacked bars or columns). Import this CSV and fill in your ASPS numbers (counts or percentages):
Suggested caption: Patient age distribution for breast augmentation (U.S., 2022). Source: ASPS 2022 Procedural Statistics.
3) Implant choices: silicone vs. saline
Modern practice strongly favors silicone implants (global ≈ 96%) with saline a small minority. Use this as the current global split; if you add a U.S. series, label year and geography clearly. isaps.org
Embed Chart 3 — Implant Type Share (Global, 2023)
Use a donut/split bar and import this ready-to-use CSV:
Caption: Silicone vs. saline share in recent global data (ISAPS Global Survey 2023).
Safety note: The FDA states silicone gel implants have a reasonable assurance of safety/effectiveness when used as labeled; individualized counseling remains essential. U.S. Food and Drug Administration
4) What does it cost?
Published average surgeon’s fee (U.S., 2022) for breast augmentation: $4,294 (ASPS). This excludes anesthesia, facility/OR, and implant costs; total patient out-of-pocket is typically higher. American Society of Plastic Surgeons
Embed Chart 4 Cost Components (Illustrative, U.S.)
Use a 100% stacked bar to show composition. Import this CSV (percentages are illustrative; keep that wording in the caption):
Suggested caption: Illustrative breakdown of total cost (shares not universal). Sources: ASPS 2022 average surgeon’s fee + public cost guidance; facility/anesthesia/implant shares shown for orientation only. American Society of Plastic Surgeons+1
5) Recovery, safety, and long-term context (evidence brief)
- Recovery: Most patients limit strenuous activity for weeks; final contour “settles” over time (follow surgeon-specific protocols).
- Implants are not lifetime devices: Some patients later choose revision/exchange; the decision is individualized.
- Evidence frame: FDA: benefits/risks are sufficiently understood for informed decision-making when used as labeled. Discuss options (implant type, placement, follow-up) with a board-certified surgeon. U.S. Food and Drug Administration
6) Methods & sources
Scope: Focus on 2000–2022 trends; 2023 ISAPS used for latest implant-type split.
Primary references
- ASPS 2022 Plastic Surgery Statistics (procedures, age tables) and Average Surgeon Fees (augmentation $4,294). American Society of Plastic Surgeons+1
- ISAPS Global Surveys (2022 report for trends; 2023 for implant-type split). isaps.org+1
- FDA safety overview of silicone gel-filled implants. U.S. Food and Drug Administration